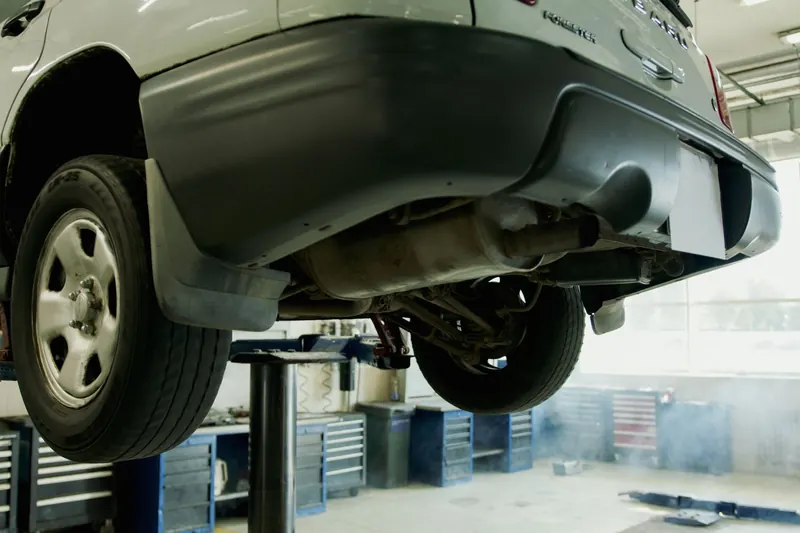
Tyres, brakes and suspension. Those are the faults that turn up most often among each model’s top recorded faults when the MOT results of 226 UK car and light van models are lined up. This page shows the faults, how often they appear and what the numbers do and do not count.
The headline numbers
In the DVSA results we hold, 5,440,296 of 25,069,536 MOT tests failed. That is 21.7%, a little over one in five. The tests are normal tests on cars in 233 models, with retests left out.
Tyre tread depth is in the top eight recorded faults for 224 of the 226 models we hold defect tables for. It is the single most-recorded fault on 143 of them.
The faults that appear most
Each model’s file holds up to eight faults. This table counts how many of the 226 models list each fault in that top eight, and adds the defect entries recorded for it.
| Fault | Models with it in their top eight (of 226) | Defect entries on failed tests |
|---|---|---|
| Tyre tread depth not in accordance with the requirements | 224 | 2,888,397 |
| Tyre seriously damaged | 221 | 1,868,987 |
| Brake disc or drum excessively weakened, insecure or fractured | 198 | 1,085,298 |
| Suspension pin, bush or joint excessively worn | 179 | 2,297,575 |
| Brake lining or pad worn below 1.5mm | 173 | 955,256 |
| Spring or spring component fractured or seriously weakened | 108 | 1,074,173 |
| Tyre cords visible or damaged | 75 | 58,624 |
| Brake pipe damaged or excessively corroded | 54 | 465,887 |
| Wiper blade missing or obviously not clearing the windscreen | 52 | 40,399 |
| Brake disc or drum significantly and obviously worn | 51 | 48,464 |
Read this as “most common among each model’s top recorded faults”. It is not a count of every fault on every car, because a fault that is not in a model’s top eight is not in these files.
What the numbers count
The entries are defects recorded on failed tests. One failed test can carry several, such as two worn tyres or a worn pad on each side, so the entries add up to more than the number of cars that failed. The fault names follow DVSA’s wording.
What you can check yourself
Tyres, brake pads and lights are the faults you can look at before the test. Our DIY pre-MOT checklist goes through them, and what to do if your MOT fails covers the next step. To read what an advisory means, see how to read MOT advisory notes.
If you are buying, look at the car’s own record with the free reg check. The free car check shows each past MOT test with its date, result, mileage and the number of defects and advisories, and the £7.99 report lists every one. Models vary a lot, as used cars with the lowest MOT fail rate shows.
How we counted
- Source. The DVSA anonymised MOT tests and results for 2025, published under the Open Government Licence v3.0. See the dataset on data.gov.uk.
- Cars and light vans, normal tests only. MOT class 4, which covers cars and light vans up to 3,000kg gross weight. Retests and abandoned tests are left out.
- Model matching. We matched the free-text make and model on each test to a clean model name and left out anything we could not match with confidence. The models we hold cover 76.6% of the tests.
- Thresholds. A model and registration-year group needs at least 200 tests to count, and a model needs at least 500 tests for its faults to be published. That leaves 226 of 233 models with a fault table.
- Up to eight. Each model’s file holds up to its eight most recorded faults. A few models list fewer. A defect entry is one defect line on a failed test, so one car can add several, and a line can be an advisory or minor item recorded on the same test.
A model with too few tests is missing rather than shown as zero. The cars in the figures are of mixed ages, and older cars fail more often, so a fail rate is not a measure of how reliable a model is.
More checks
- car check, free, from official DVLA and DVSA data
- free car check, exactly what is free and what is not
- car check cost, free, from £7.99 and what others charge
- what a car check is, what it covers and what it misses
- car check before viewing a used car, what to do before you travel
- service history check by reg, what the official records hold
- cars with the lowest MOT fail rate, and why that is not reliability
- car check comparison, prices and what each provider includes
- Car check report options, Compare the three reports
- Imported car check, Imported, non-EU import and exported history
- Number plate history check, Plate and colour changes
- Previous owners check, How many keepers and when the last change was
- Scrapped car check, Is the car recorded as scrapped?
- Write off check, insurance write-off category, Cat S, Cat N and the older Cat C and D
Frequently asked questions
What is the most common MOT failure?
Among the faults recorded most often for each model, tyre tread depth. It is in the top eight faults for 224 of the 226 models we hold defect tables for, and it is the single most-recorded fault on 143 of them. This is not a count across every car in the UK, because each model's file holds only its top eight faults.
How many cars fail their MOT?
In the DVSA 2025 results we hold, 21.7% of tests failed: 5,440,296 of 25,069,536. That covers 233 models and normal car tests, with retests left out.
Are these counts of failed cars?
No. They count defect entries recorded on failed tests. One failed test can carry several, so the entries add up to more than the number of cars that failed.
Where does the data come from?
The DVSA anonymised MOT tests and results, published under the Open Government Licence v3.0, for tests in 2025.
Can I see how often my model fails?
Yes, for the models we hold data for. Their guides show the MOT record, and the page on the lowest MOT fail rates lists the models with the lowest and highest rates.
How do I avoid a failure?
Check the common causes before the test: tyres, brakes, lights and wipers. Our DIY pre-MOT checklist walks through them.
Check a car's MOT record
Free profile in seconds. Reports from £7.99.
No signup. No subscription.